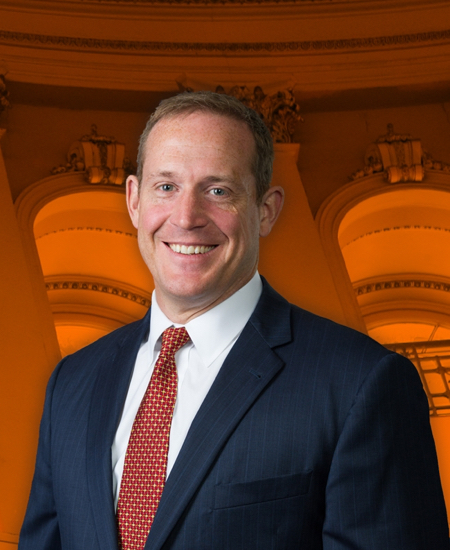
Ted Budd
Republican
· NC Senate · 119th Congress
Senate Committee on Commerce (Chair) · and Competitiveness (Chair) · House Committee on Financial Services · Joint Economic Committee · Senate Committee on Armed Services · and Transportation · and Innovation · Senate Committee on Small Business and Entrepreneurship · Senate Select Committee on Intelligence
Influence Score
72.2
Moderately exposed
— ◊ —
This score measures financial influence across twelve categories. Each bar shows how this member compares to all others in Congress. Longer bars mean more exposure.
Score breakdown — twelve categories
Contributionsmoney from PACs (political action committees) and individual donors
4.9
/ 12
Outside spendingmoney spent by groups to help elect them
6.0
/ 6
Spent to help elect them
$22,326,746
Outside groups that spent to help elect this member — this drives the outside-spending bar above
Spent to defeat this member
$17,380,666
Outside groups that spent to defeat this member (not counted in this score)
Lobbyinghow hard lobbyists push the committees this member sits on
6.3
/ 10
Revolving door
former staff now working as lobbyists
0.0
/ 3
Vote alignmenthow often they vote the way their donors want
4.0
/ 12
Contribution timingmoney arriving near key votes
3.3
/ 6
Stock tradesbuying stocks in industries they regulate
0.0
/ 1
Dark moneyfunding from groups that hide their donors
< 0.1
/ 2
Outbound money distributionmoney this member sends out to the party and to colleagues
9.1
/ 16
Cluster network breadthhow many coordinated funding networks back this member
7.8
/ 10
Committee jurisdiction powerthe legislative reach of the committees this member sits on
10.0
/ 10
Foreign interestforeign-interest money — Israel-policy PACs and FARA-registered institutional lobbying allocated by committee jurisdiction
6.3
/ 12
FARA institutional lobbying
This member’s committees are targeted by $57.11M in lobbying from FARA-registered firms representing South Korea, Japan, Saudi Arabia. This exposure is weighted at 0.2% of face value in the score — $114K.
— ◊ —
Score across four congresses
Score and tier for each Congress. Members are ranked against others in the same Congress, so tiers are comparable across rows. Raw scores reflect different data availability per Congress.
| Congress | Score | Tier |
|---|---|---|
| 116th · 2019-2021 | 53.5 | Moderately exposed |
| 117th · 2021-2023 | 61.6 | Moderately exposed |
| 118th · 2023-2025 | 60.4 | Moderately exposed |
| 119th · 2025-2027 | 72.1 | Highly exposed |
— ◊ —
Biggest funding source
The single network behind the most money and influence
Network
CLUB FOR GROWTH ACTION
Total money from this network
$13,572,828
Number of funding networks contributing
1
— ◊ —
Where most of the money comes from
What share of their combined contributions and outside spending comes from a single network. Party committees are excluded.
Network
SPECIAL OPERATIONS FOR AMERICA
Share from this one network
1.7%
Amount from this network
$31,500
Total from all networks
$1,910,709
Networks contributing
439
— ◊ —
Who funds Budd
Every funding network we can measure, ranked by influence
$23,178,891
— ◊ —
Does the money match their power?
Whether their money comes from the industries their committees actually oversee
Money from industries they regulate
5.5%
Extra weight when money matches their committees
2.00×
Share of outside spending tied to their policy areas
55.0%
— ◊ —
Money timed to key votes
Donations arriving near key votes in the policy areas this member regulates
Times money arrived near a vote
6
Money that arrived near votes
$40K
Distinct donors
34
Distinct employers
1
Share of their total fundraising
2.72%
Biggest clusters of timed money
BRIGHTHOUSE FINANCIAL
$17K
BRIGHTHOUSE FINANCIAL
$12K
BRIGHTHOUSE FINANCIAL
$7K
BRIGHTHOUSE FINANCIAL
$2K
BRIGHTHOUSE FINANCIAL
$2K
BRIGHTHOUSE FINANCIAL
$1K
BRIGHTHOUSE FINANCIAL
$500
F M BANK
$500
— ◊ —
Top Donors
Biggest sources of contributions, grouped by employer, this cycle
SIG
$35.01M
ULINE
$32.31M
ORACLE
$30.10M
FTX DIGITAL MARKETS
$15.07M
BLOOMBERG
$14.40M
VALMORE MANAGEMENT
$12.39M
RENAISSANCE TECHNOLOGIES
$10.68M
HOMEMAKER
$6.81M
HONEYWELL INTERNATIONAL
$6.69M
FEDERAL AVIATION ADMINISTRATION
$6.43M
FTX
$4.86M
HENDRICKS HOLDING
$4.53M
BOEING
$4.38M
LONE PINE CAPITAL
$4.15M
SEQUOIA CAPITAL
$4.04M
THE MARCUS MILLICHAP
$3.50M
LOCKHEED MARTIN
$3.12M
EY
$3.02M
NETFLIX
$3.01M
THE SIMONS
$3.00M
Where the outside money comes from
How much of the outside spending for and against Ted Budd comes from groups that disclose their donors versus groups that hide them
Total outside spending received
$40.10M
Disclosed outside spending
$18.54M
Dark-money outside spending
$21.55M
Share that is dark money
53.75%
Dark money tied to their policy areas
$174K
Groups hiding their donors
13
By funding network
SMP
$11.05M
AMERICANS FOR PROSPERITY ACTION, INC. (AFP ACTION) DBA CVA ACTION AND DBA LIBRE ACTION
$9.26M
CLUB FOR GROWTH ACTION
$7.02M
WOMEN VOTE
$3.06M
OPPORTUNITY MATTERS FUND, INC.
$1.53M
CAROLINA SENATE FUND
$1.22M
TRUTH AND JUSTICE FUND COMPANY
$1.02M
REPUBLICAN LEADERSHIP FUND INC.
$949K
COMMITTEE TO DEFEAT THE PRESIDENT
$844K
AMERICAN DREAM FEDERAL ACTION
$517K
VOTE FOR EQUALITY
$455K
GMI PAC, INC.
$400K
OPPORTUNITY MATTERS FUND ACTION
$400K
SENATE CONSERVATIVES ACTION
$340K
THE CONSERVATIVE CAUCUS DBA AMERICANS FOR CONSTITUTIONAL LIBERTY
$186K
Groups that hide their donors
$11.05M
$641K
$13K
$7K
2 smaller groups under $500
$511
Likely donors behind the dark money supporting this member
Inferred
Donors who fund the disclosed PACs in the same network as the hidden groups above. "Coverage" is how many of that network's disclosed groups a donor funds — the more they fund, the more likely they also back the hidden group.
JEFFREY J KOLOZE
$8K
GEORGE ERBACHER
$3K
THOMAS MORRIS
$2K
EDWIN BOTERO
$300
NEVADANS FOR STEVEN HORSFORD
$80K
TITUS FOR CONGRESS
$80K
SUSIE LEE FOR CONGRESS
$79K
AMERICA S PROMISE
$4.73M
BLAINE FOR CONGRESS
$1.51M
CISCOMANI FOR CONGRESS
$24K
— ◊ —
Pro-Israel network donors
This counts contributions to this member from individuals whose FEC filings also show contributions to one of the 16 pro-Israel political action committees tracked by the Index. It is a measure of donor overlap — not a claim about why any individual gave, and not part of the influence score.
179 individuals who also gave to pro-Israel PACs contributed $441K to Ted Budd across 291 contributions.
Total from shared contributors
$441K
Shared contributors
179
Contributions
291
By cycle
| Cycle | Shared donors | Gifts | Total |
|---|---|---|---|
| 2022 | 171 | 255 | $414K |
| 2024 | 9 | 23 | $18K |
| 2026 | 4 | 13 | $9K |
— ◊ —
Ted Budd sits in the middle of this Congress on the index. There is a measured sponsor relationship, but the vote-alignment signal is weaker — money flows; the votes do not follow in lockstep.
Data: FEC (Federal Election Commission) filings · 118th–119th Congress · lobbying disclosures · VoteView recorded votes
All findings derived programmatically from public records · No prior knowledge required
All findings derived programmatically from public records · No prior knowledge required