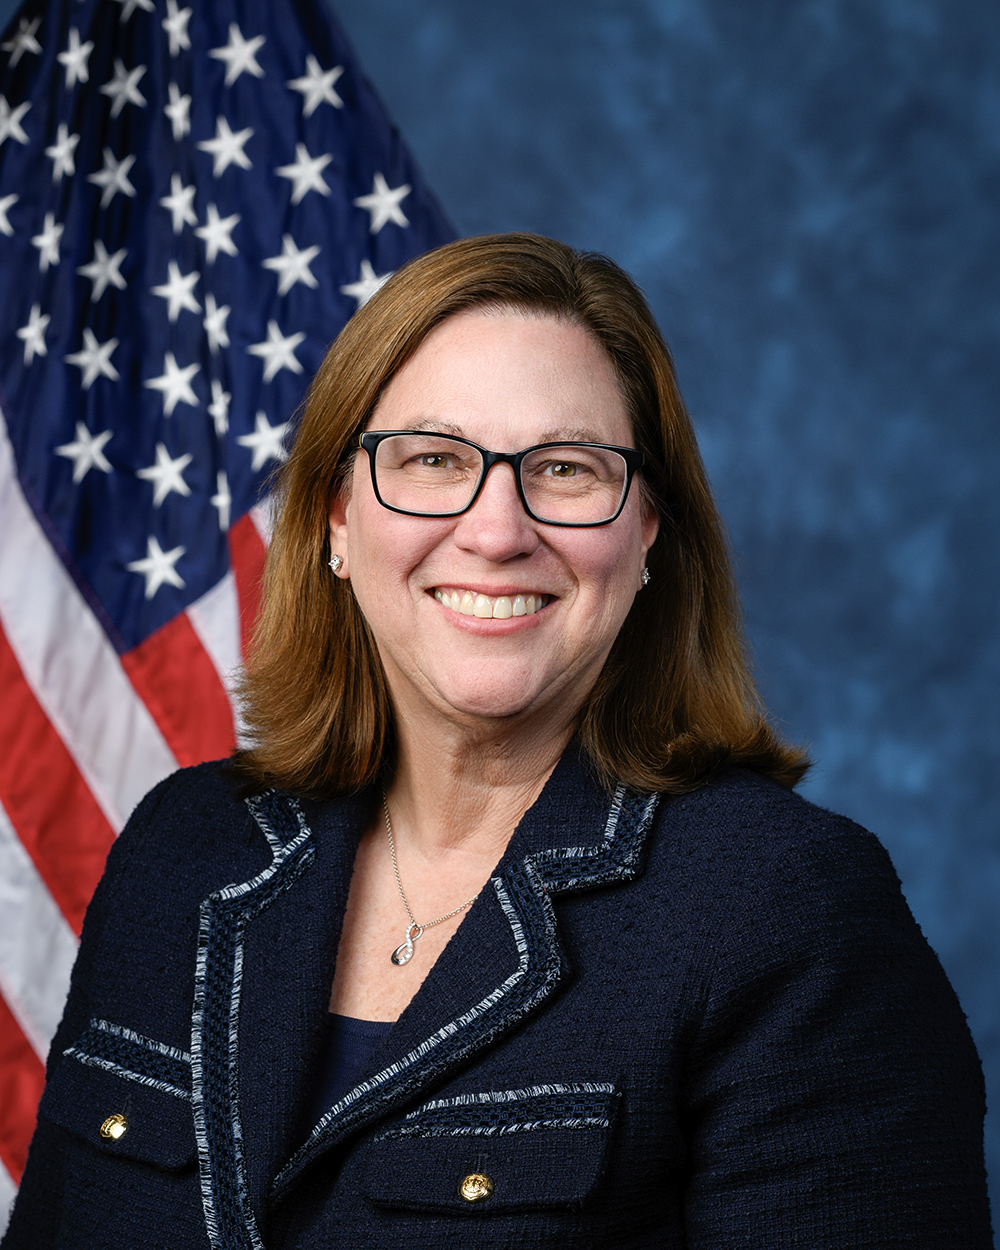
Julie Johnson
Democrat
· TX-33 · 119th Congress
House Committee on Foreign Affairs · House Committee on Homeland Security · House Committee on House Administration · Joint Committee of Congress on the Library
Influence Score
47.0
Least exposed
— ◊ —
This score measures financial influence across twelve categories. Each bar shows how this member compares to all others in Congress. Longer bars mean more exposure.
Score breakdown — twelve categories
Contributionsmoney from PACs (political action committees) and individual donors
2.9
/ 12
Outside spendingmoney spent by groups to help elect them
3.8
/ 6
Spent to help elect them
$2,205,310
Outside groups that spent to help elect this member — this drives the outside-spending bar above
Spent to defeat this member
$165,855
Outside groups that spent to defeat this member (not counted in this score)
Lobbyinghow hard lobbyists push the committees this member sits on
3.3
/ 10
Revolving door
former staff now working as lobbyists
0.0
/ 3
Vote alignmenthow often they vote the way their donors want
5.7
/ 12
Contribution timingmoney arriving near key votes
0.0
/ 6
Stock tradesbuying stocks in industries they regulate
< 0.1
/ 1
Dark moneyfunding from groups that hide their donors
0.0
/ 2
Outbound money distributionmoney this member sends out to the party and to colleagues
10.4
/ 16
Cluster network breadthhow many coordinated funding networks back this member
4.7
/ 10
Committee jurisdiction powerthe legislative reach of the committees this member sits on
4.0
/ 10
Foreign interestforeign-interest money — Israel-policy PACs and FARA-registered institutional lobbying allocated by committee jurisdiction
2.7
/ 12
Israel-policy PACs behind this score
AMERICAN ISRAEL PUBLIC AFFAIRS COMMITTEE POLITICAL ACTION COMMITTEE
$4,994 direct
JSTREETPAC
$1,150 direct
DMFI PAC
$1,000 direct
FARA institutional lobbying
This member’s committees are targeted by $18.79M in lobbying from FARA-registered firms representing South Korea, Japan, Saudi Arabia. This exposure is weighted at 0.2% of face value in the score — $38K.
— ◊ —
Biggest funding source
The single network behind the most money and influence
Network
FAIRSHAKE
Total money from this network
$961,272
Number of funding networks contributing
1
— ◊ —
Where most of the money comes from
What share of their combined contributions and outside spending comes from a single network. Party committees are excluded.
Network
EQUALITY PAC
Share from this one network
40.8%
Amount from this network
$1,072,697
Total from all networks
$2,628,495
Networks contributing
208
— ◊ —
Who funds Johnson
Every funding network we can measure, ranked by influence
$2,720,415
— ◊ —
Does the money match their power?
Whether their money comes from the industries their committees actually oversee
Money from industries they regulate
0.5%
Extra weight when money matches their committees
1.50×
Share of outside spending tied to their policy areas
100.0%
— ◊ —
Money timed to key votes
Donations arriving near key votes in the policy areas this member regulates
No suspicious timing patterns detected.
— ◊ —
Top Donors
Biggest sources of contributions, grouped by employer, this cycle
HONEYWELL INTERNATIONAL
$6.70M
FEDERAL AVIATION ADMINISTRATION
$6.43M
HONEYWELL INTERNATIONAL
$3.80M
LOCKHEED MARTIN
$3.12M
COMCAST CC OF WILLOW GROVE
$2.07M
UP RAILROAD
$1.76M
AH CAPITAL MANAGEMENT
$1.76M
CHARTER
$1.41M
THE ELEVANCE HEALTH COMPANIES
$1.33M
UNITED AIRLINES
$1.30M
DELL TECHNOLOGIES
$1.19M
VERIZON RSRCS
$1.16M
ELI LILLY AND
$1.15M
PFIZER
$1.05M
UNITED PARCEL SERVICE
$1.05M
GOOGLE
$1.00M
PHILLIPS 66
$1.00M
AKONADI
$1.00M
USPS
$966K
GENERAL MOTORS
$906K
Where the outside money comes from
How much of the outside spending for and against Julie Johnson comes from groups that disclose their donors versus groups that hide them
By funding network
EQUALITY PAC
$987K
FAIRSHAKE
$961K
NUESTRO PAC
$220K
NEW LEADERSHIP PAC
$166K
NATIONAL ASSOCIATION OF REALTORS CONGRESSIONAL FUND
$24K
DON'T MESS WITH TX PAC
$11K
DMFI PAC
$2K
COMMUNITY CHANGE VOTERS
$680
HUMAN RIGHTS CAMPAIGN EQUALITY VOTES PAC
$30
SIERRA CLUB INDEPENDENT ACTION
$10
— ◊ —
Pro-Israel network donors
This counts contributions to this member from individuals whose FEC filings also show contributions to one of the 16 pro-Israel political action committees tracked by the Index. It is a measure of donor overlap — not a claim about why any individual gave, and not part of the influence score.
73 individuals who also gave to pro-Israel PACs contributed $208K to Julie Johnson across 86 contributions.
Total from shared contributors
$208K
Shared contributors
73
Contributions
86
By cycle
| Cycle | Shared donors | Gifts | Total |
|---|---|---|---|
| 2024 | 31 | 35 | $86K |
| 2026 | 44 | 51 | $122K |
— ◊ —
Julie Johnson ranks among the least exposed members of this Congress relative to their colleagues. Money may flow, but the votes do not track the top funding networks. Least exposed is a relative position, not a finding of no exposure.
Data: FEC (Federal Election Commission) filings · 118th–119th Congress · lobbying disclosures · VoteView recorded votes
All findings derived programmatically from public records · No prior knowledge required
All findings derived programmatically from public records · No prior knowledge required