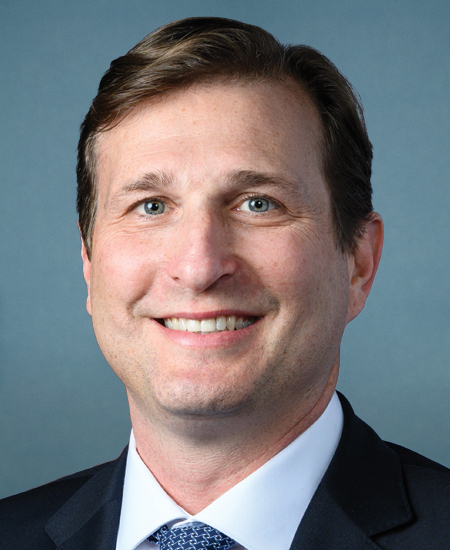
Daniel S. Goldman
Democrat
· NY-10 · 119th Congress
House Committee on Homeland Security · House Committee on the Judiciary
Influence Score
56.1
Moderately exposed
↑ +12.2
vs 118th (43.8)
— ◊ —
This score measures financial influence across twelve categories. Each bar shows how this member compares to all others in Congress. Longer bars mean more exposure.
Score breakdown — twelve categories
Contributionsmoney from PACs (political action committees) and individual donors
1.7
/ 12
Outside spendingmoney spent by groups to help elect them
1.3
/ 6
Spent to help elect them
$278,562
Outside groups that spent to help elect this member — this drives the outside-spending bar above
Lobbyinghow hard lobbyists push the committees this member sits on
4.6
/ 10
Revolving door
former staff now working as lobbyists
0.0
/ 3
Vote alignmenthow often they vote the way their donors want
8.7
/ 12
Contribution timingmoney arriving near key votes
3.5
/ 6
Stock tradesbuying stocks in industries they regulate
0.1
/ 1
Dark moneyfunding from groups that hide their donors
0.0
/ 2
Outbound money distributionmoney this member sends out to the party and to colleagues
9.9
/ 16
Cluster network breadthhow many coordinated funding networks back this member
3.6
/ 10
Committee jurisdiction powerthe legislative reach of the committees this member sits on
2.7
/ 10
Foreign interestforeign-interest money — Israel-policy PACs and FARA-registered institutional lobbying allocated by committee jurisdiction
8.8
/ 12
Israel-policy PACs behind this score
AMERICAN ISRAEL PUBLIC AFFAIRS COMMITTEE POLITICAL ACTION COMMITTEE
$51,520 direct
CITIZENS ORGANIZED POLITICAL ACTION COMMITTEE
$5,000 direct
JSTREETPAC
$3,515 direct
DMFI PAC
$2,000 direct
FARA institutional lobbying
This member’s committees are targeted by $25.29M in lobbying from FARA-registered firms representing South Korea, Saudi Arabia, Japan. This exposure is weighted at 0.2% of face value in the score — $51K.
— ◊ —
Score across four congresses
Score and tier for each Congress. Members are ranked against others in the same Congress, so tiers are comparable across rows. Raw scores reflect different data availability per Congress.
| Congress | Score | Tier |
|---|---|---|
| 116th · 2019-2021 | — | — |
| 117th · 2021-2023 | — | — |
| 118th · 2023-2025 | 43.8 | Least exposed |
| 119th · 2025-2027 | 56.0 | Moderately exposed |
— ◊ —
Biggest funding source
The single network behind the most money and influence
Network
FAIRSHAKE
Total money from this network
$226,280
Number of funding networks contributing
1
— ◊ —
Where most of the money comes from
What share of their combined contributions and outside spending comes from a single network. Party committees are excluded.
Share from this one network
7.4%
Amount from this network
$51,520
Total from all networks
$700,258
Networks contributing
134
— ◊ —
Who funds Goldman
Every funding network we can measure, ranked by influence
— ◊ —
Does the money match their power?
Whether their money comes from the industries their committees actually oversee
Money from industries they regulate
96.2%
Extra weight when money matches their committees
1.50×
Share of outside spending tied to their policy areas
100.0%
— ◊ —
Money timed to key votes
Donations arriving near key votes in the policy areas this member regulates
Times money arrived near a vote
54
Money that arrived near votes
$103K
Distinct donors
65
Distinct employers
28
Share of their total fundraising
2.86%
Biggest clusters of timed money
BLUE RAVEN LLP
$5K
KING SPALDING LLP
$4K
PAUL WEISS
$4K
PROSKAUER ROSE LLP
$4K
SIMPSON THACHER BARTLETT LLP
$4K
COINBASE
$3K
LATHAM WATKINS LLP
$3K
LIEFF CABRASER HEIMANN BERNSTEIN LLP
$3K
SIMPSON THACHER BARTLETT LLP
$3K
WINSTON STRAWN LLP
$3K
— ◊ —
Top Donors
Biggest sources of contributions, grouped by employer, this cycle
FEDERAL AVIATION ADMINISTRATION
$6.43M
USPS
$2.21M
AH CAPITAL MANAGEMENT
$1.75M
UNITED AIRLINES
$1.30M
COZEN O CONNOR
$1.17M
VERIZON RSRCS
$1.16M
AT T SERVICES
$1.06M
UNITED AIRLINES
$867K
COZEN O CONNOR
$831K
GREYLOCK
$650K
AKIN GUMP STRAUSS HAUER FELD LLP
$640K
AFSCME INT L
$590K
SV ANGEL
$572K
AFSCME INT L
$564K
AT T SERVICES
$561K
DELTA AIR LINES
$536K
LAUDER
$500K
GREENBERG TRAURIG
$487K
OMAHA FIRE DEPT
$465K
INT L OF MACHINISTS
$449K
Where the outside money comes from
How much of the outside spending for and against Daniel S. Goldman comes from groups that disclose their donors versus groups that hide them
By funding network
FAIRSHAKE
$151K
MAINSTREAM DEMOCRATS PAC
$102K
TZEDEK PAC
$26K
SIERRA CLUB INDEPENDENT ACTION
$10
— ◊ —
Pro-Israel network donors
This counts contributions to this member from individuals whose FEC filings also show contributions to one of the 16 pro-Israel political action committees tracked by the Index. It is a measure of donor overlap — not a claim about why any individual gave, and not part of the influence score.
407 individuals who also gave to pro-Israel PACs contributed $821K to Daniel S. Goldman across 544 contributions.
Total from shared contributors
$821K
Shared contributors
407
Contributions
544
By cycle
| Cycle | Shared donors | Gifts | Total |
|---|---|---|---|
| 2022 | 60 | 67 | $103K |
| 2024 | 146 | 180 | $286K |
| 2026 | 238 | 297 | $432K |
— ◊ —
Daniel S. Goldman sits in the middle of this Congress on the index. There is a measured sponsor relationship, but the vote-alignment signal is weaker — money flows; the votes do not follow in lockstep.
Data: FEC (Federal Election Commission) filings · 118th–119th Congress · lobbying disclosures · VoteView recorded votes
All findings derived programmatically from public records · No prior knowledge required
All findings derived programmatically from public records · No prior knowledge required